Klimate Kundli (DesignUp, 2026)
Oct 2026 • Case Study
A climate birth chart, a pocket-sized keepsake, and a growing constellation of everyone who stopped by. Klimate Kundli returned for DesignUp 2026 in Bengaluru.
Nithya & I extended the VizChitra exhibit with climate signs, matches, and a shared screen, and rebuilt the input flow for phones and booth iPads.
The readings live on at klimatekundli.com.
The kundli leaves the booth
At VizChitra, Klimate Kundli lived inside a curtained booth, with a laptop, a printer, and Dodo, our parrot astrologer. You gave it your birth year and the places you’d lived; it read back the climate you’d lived through.
For DesignUp, we wanted the reading to extend beyond the person at the screen. A conference is full of strangers with overlapping lives. Could the kundli give them something to recognise in each other?
We added climate signs, three kinds of matches, and a shared sky of visitors. The charts, the public datasets, and the thoroughly questionable upaay stayed.
Asking less of the visitor
The VizChitra timeline had a catch: to add another city, you first had to shorten the previous stay. Once someone explained it, it made sense. The interface needed to do the explaining itself.
I tried a conversational wizard: did you move, where did you go, when did you go, did you move again? It removed the range-editing puzzle, but each move now took three screens. A well-intentioned interrogation.
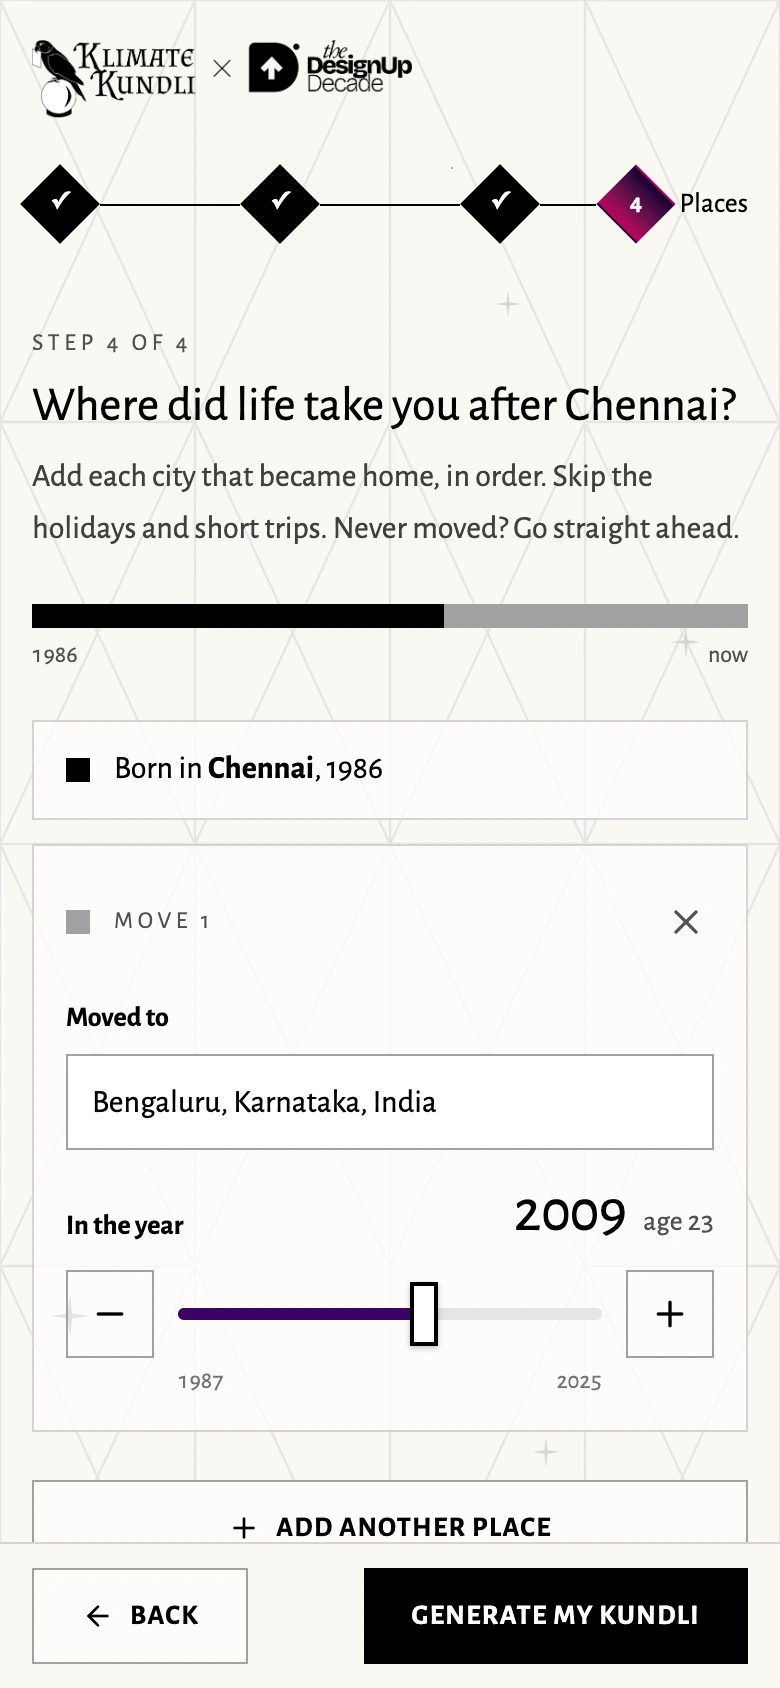
The next version brought every move onto one page. Each needed just a city and an approximate year. A strip above showed the resulting stays; the software joined their dates without gaps or overlaps. The year slider had one thumb, with −/+ buttons for precision. Visitors could see and correct the whole journey before generating.
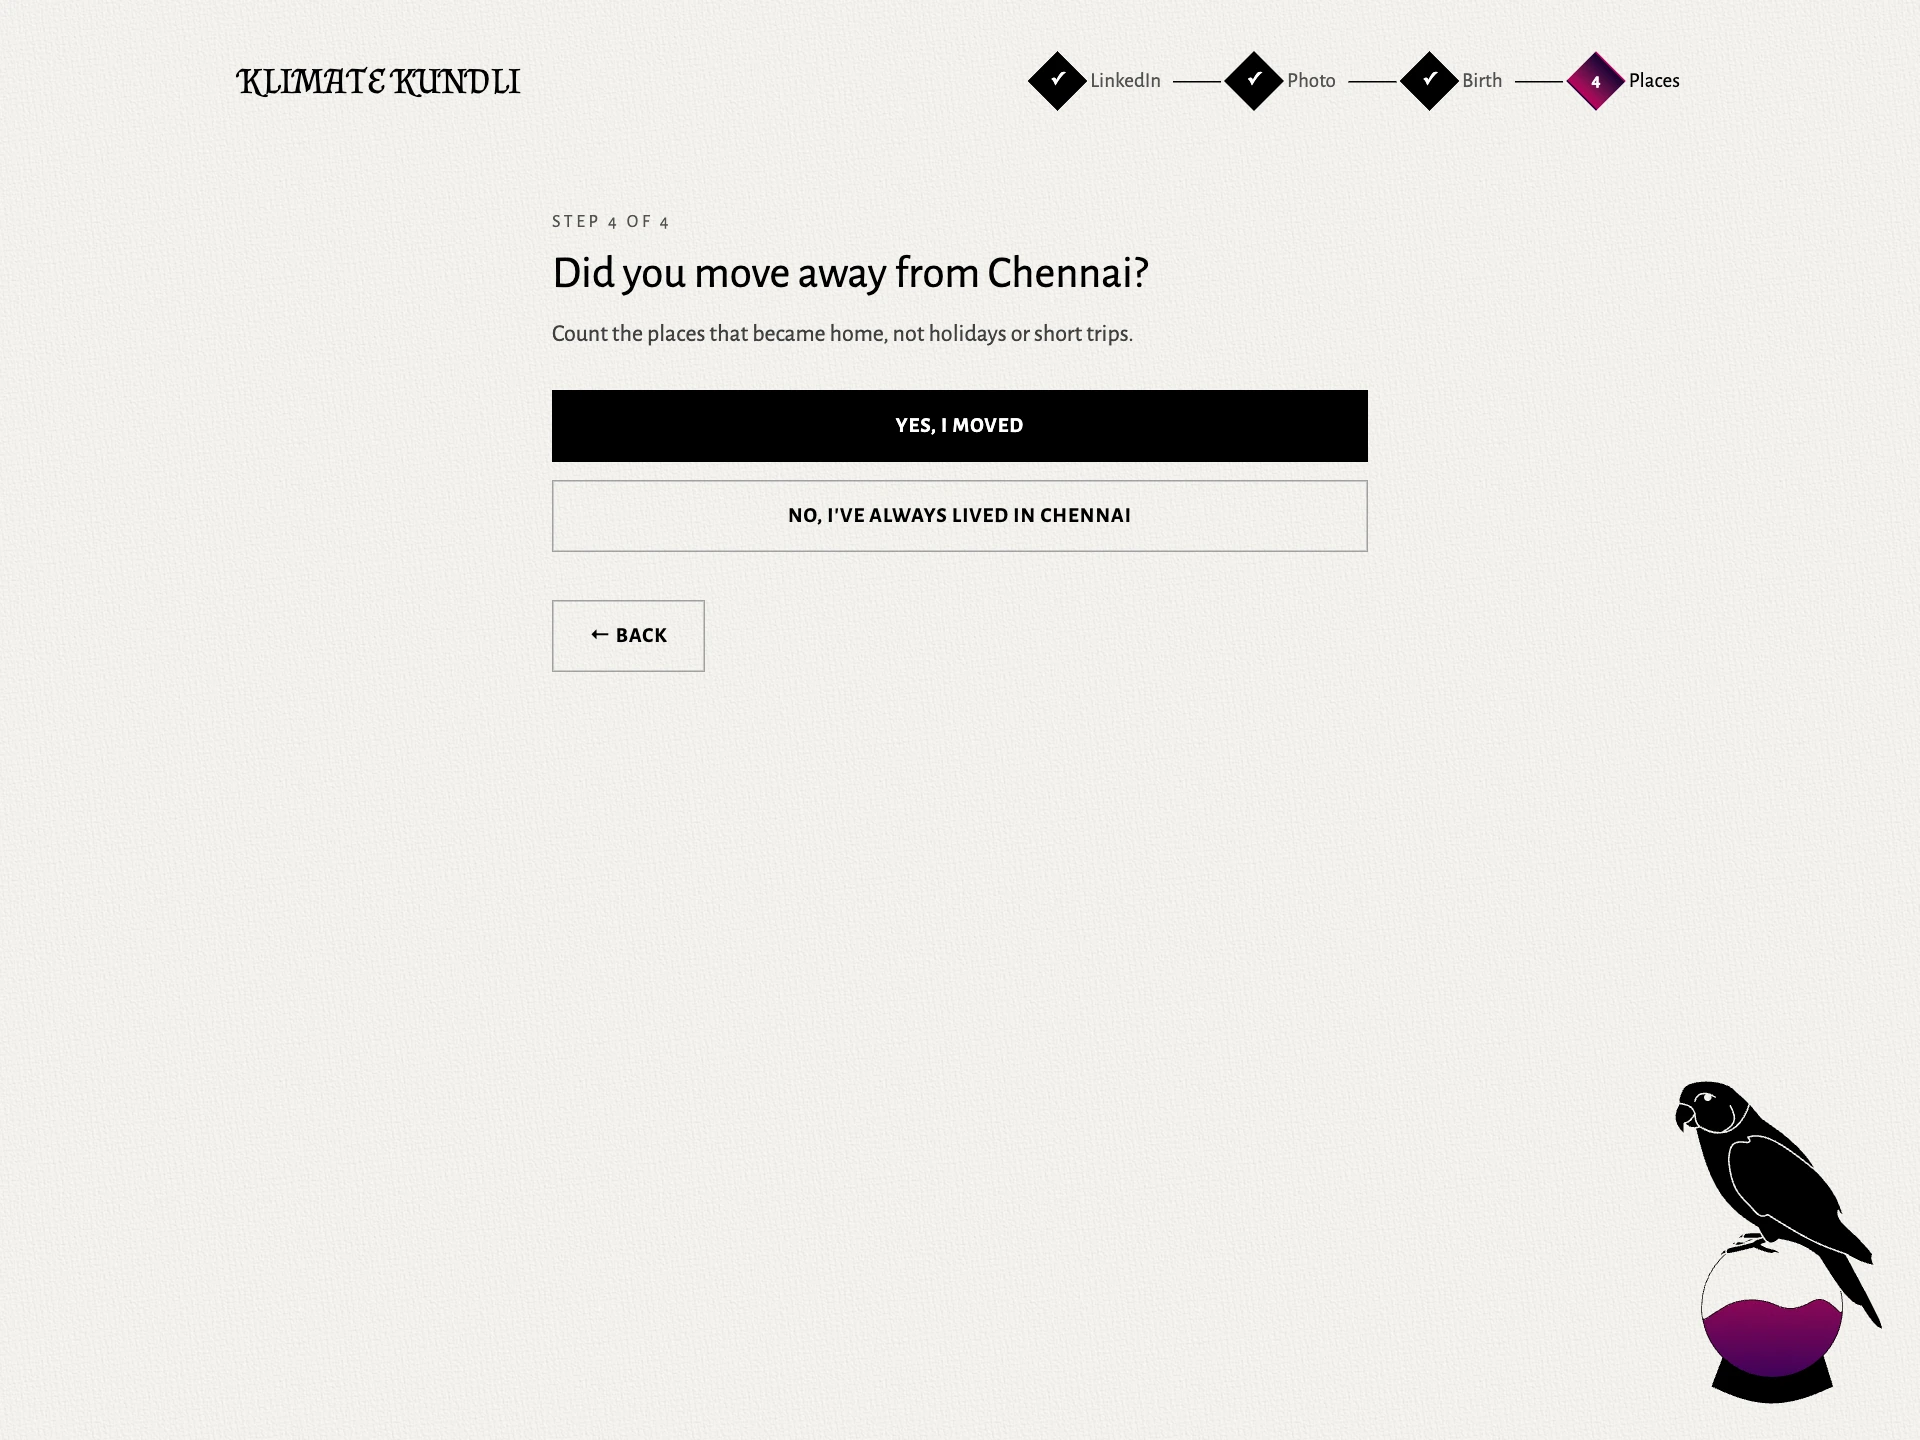
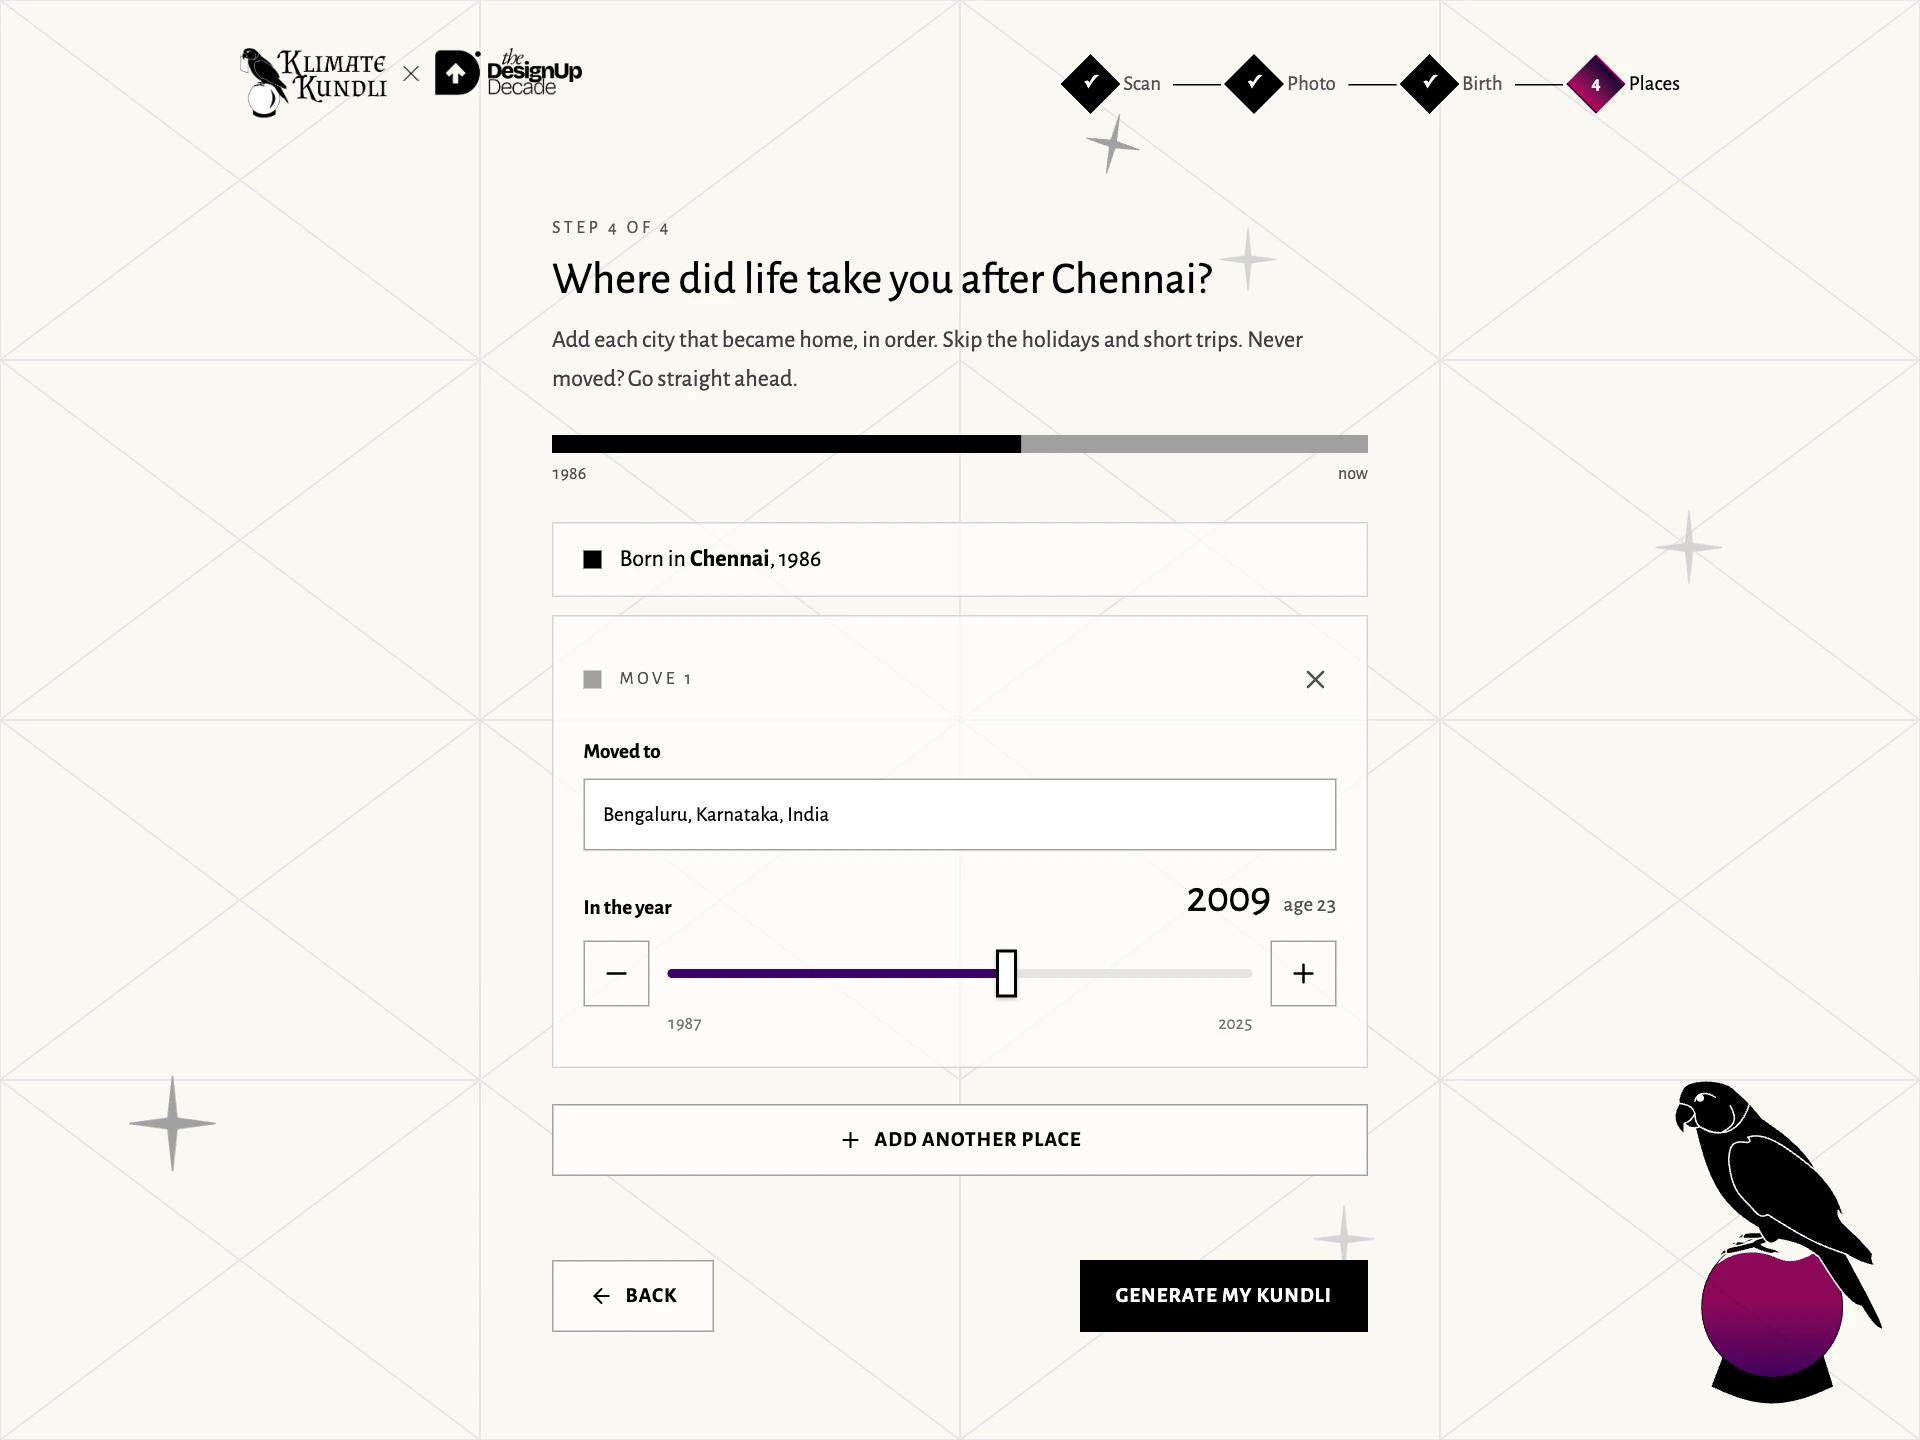
The event flow had four steps: scan a badge or LinkedIn QR, take a pixel portrait, enter birth details, add places. It worked on the booth iPads and visitors’ phones. The white canvas, crease lines, parrot and magenta crystal ball carried through.
Finding our five signs
Our early notes sorted people by how they moved: stayed, returned, settled elsewhere, kept moving. But a list of cities couldn’t tell us why someone left.
The signs became about what those moves did to your summers. Even that needed a correction. On annual averages, Delhi and Bengaluru looked surprisingly close: about 1.1°C apart. Compare their summers and the gap was about 5.3°C. Delhi’s winter had been doing rather a lot of hiding.
We used each city’s three hottest months, averaged over the same recent years. That kept the comparison about places, without confusing a move with warming between decades.
| Sign | What your journey says |
|---|---|
| Anchor | You stayed in one city. |
| Seeker | You moved into hotter summers. |
| Renouncer | You moved into cooler summers. |
| Looper | You lived through different summers, then returned to summers like your first. |
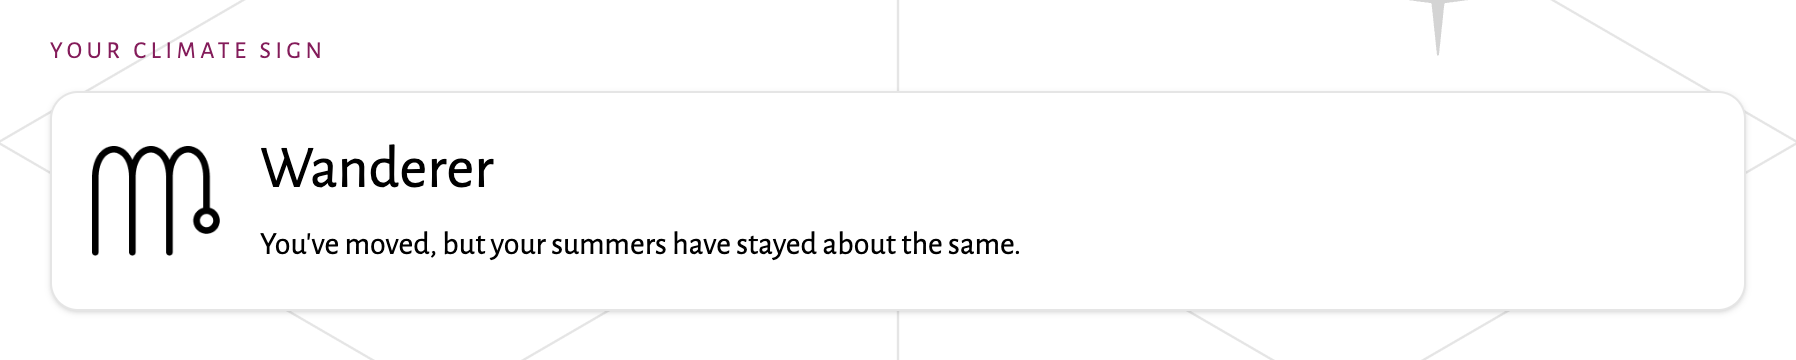
| Wanderer | You changed cities; your summers stayed much the same. |
“Different” meant a gap greater than 3.25°C. A Looper’s detour had to last at least two years. Each sign had a rule we could explain to the person receiving it.
A sky that could hold the room
The portrait was part of the reading’s arrival. The camera drew a small pixel portrait, removed the background when it could, and kept only that processed image. The raw photograph wasn’t stored.
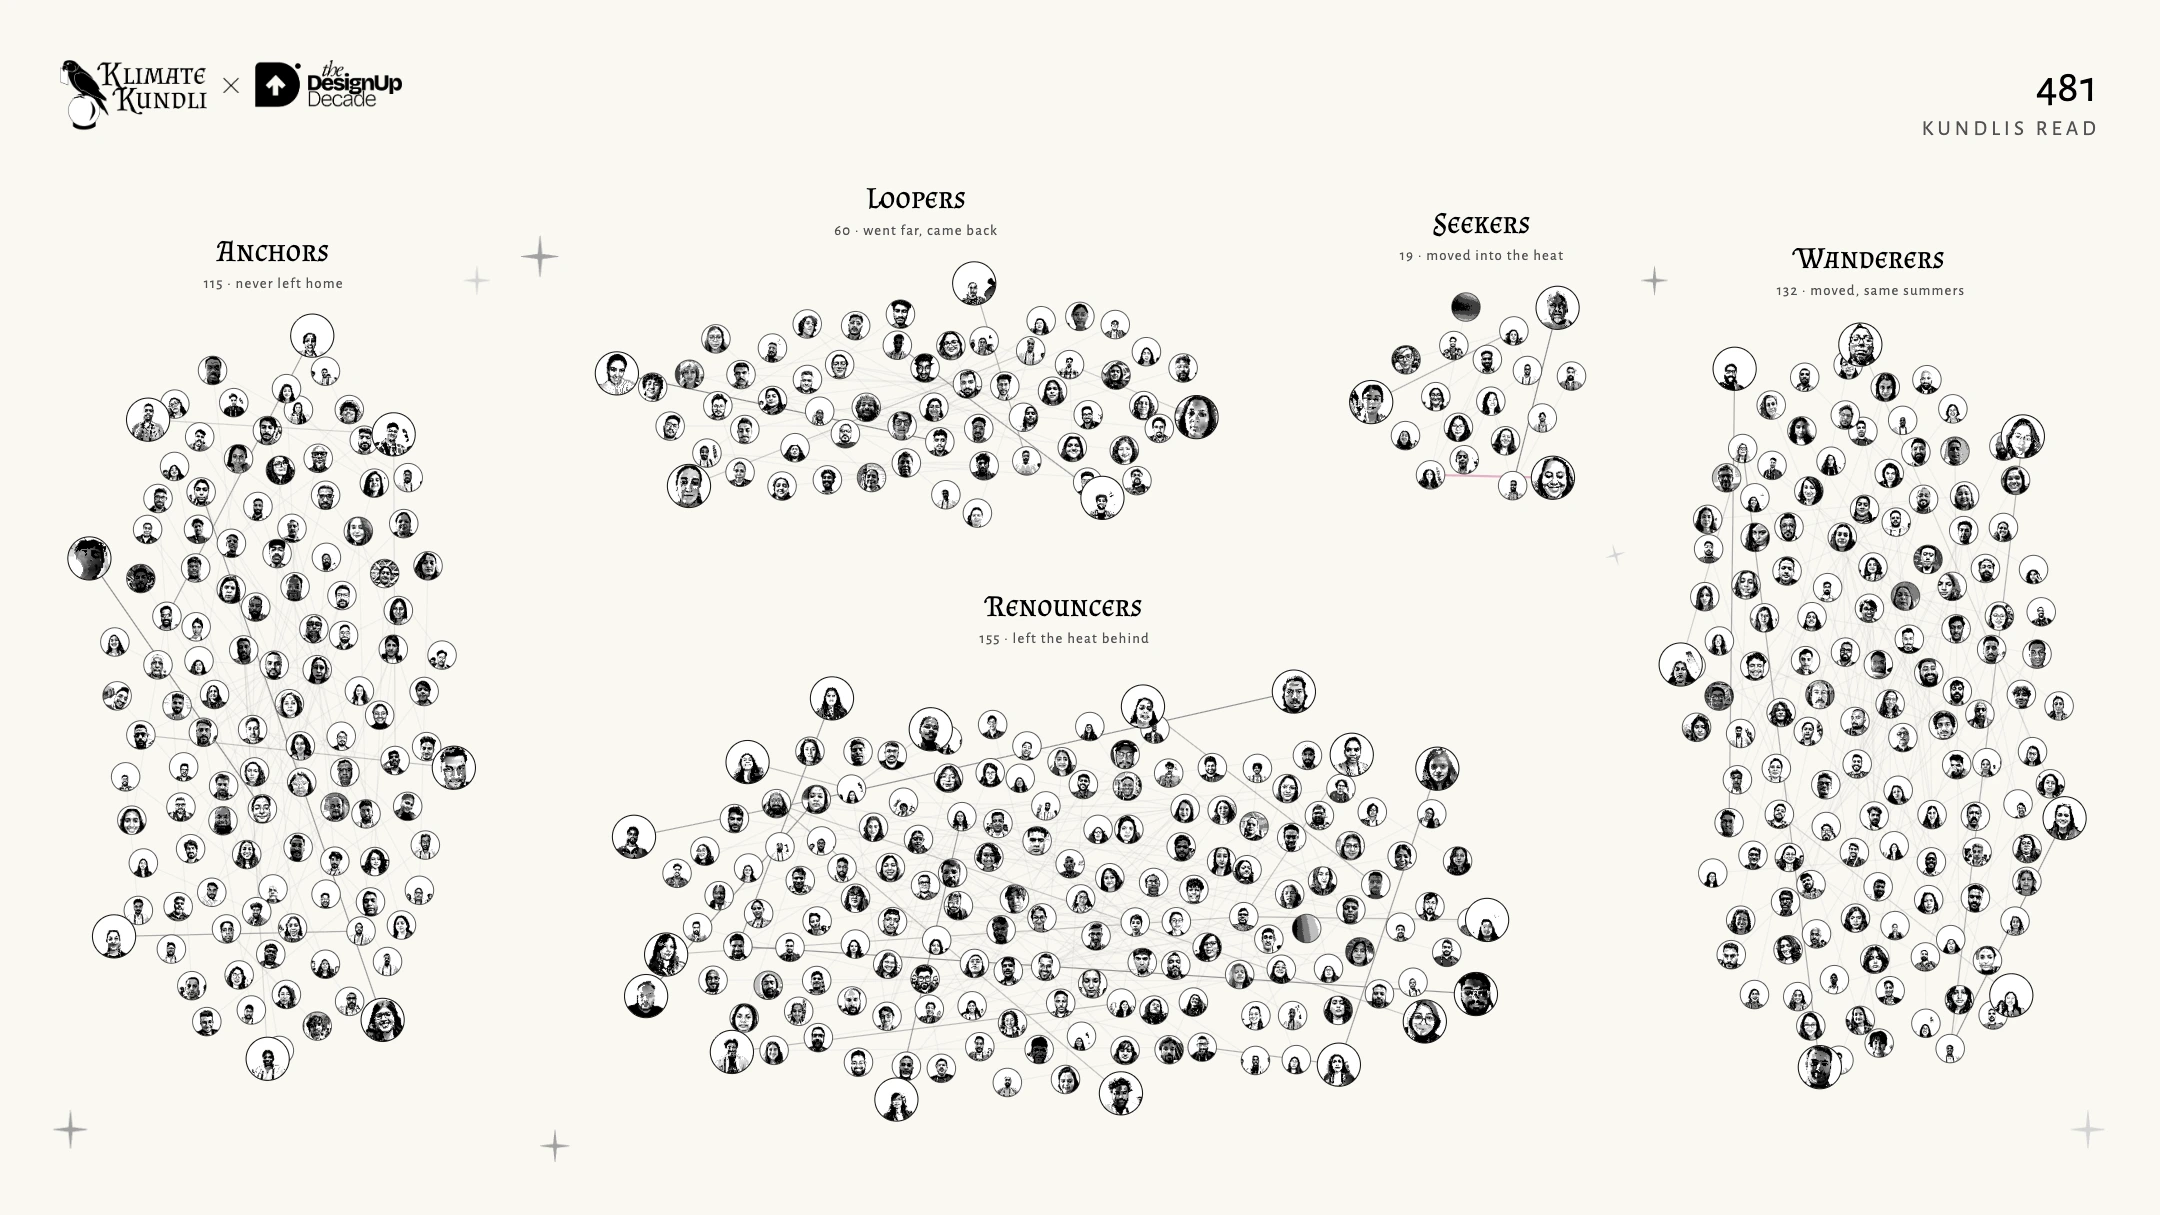
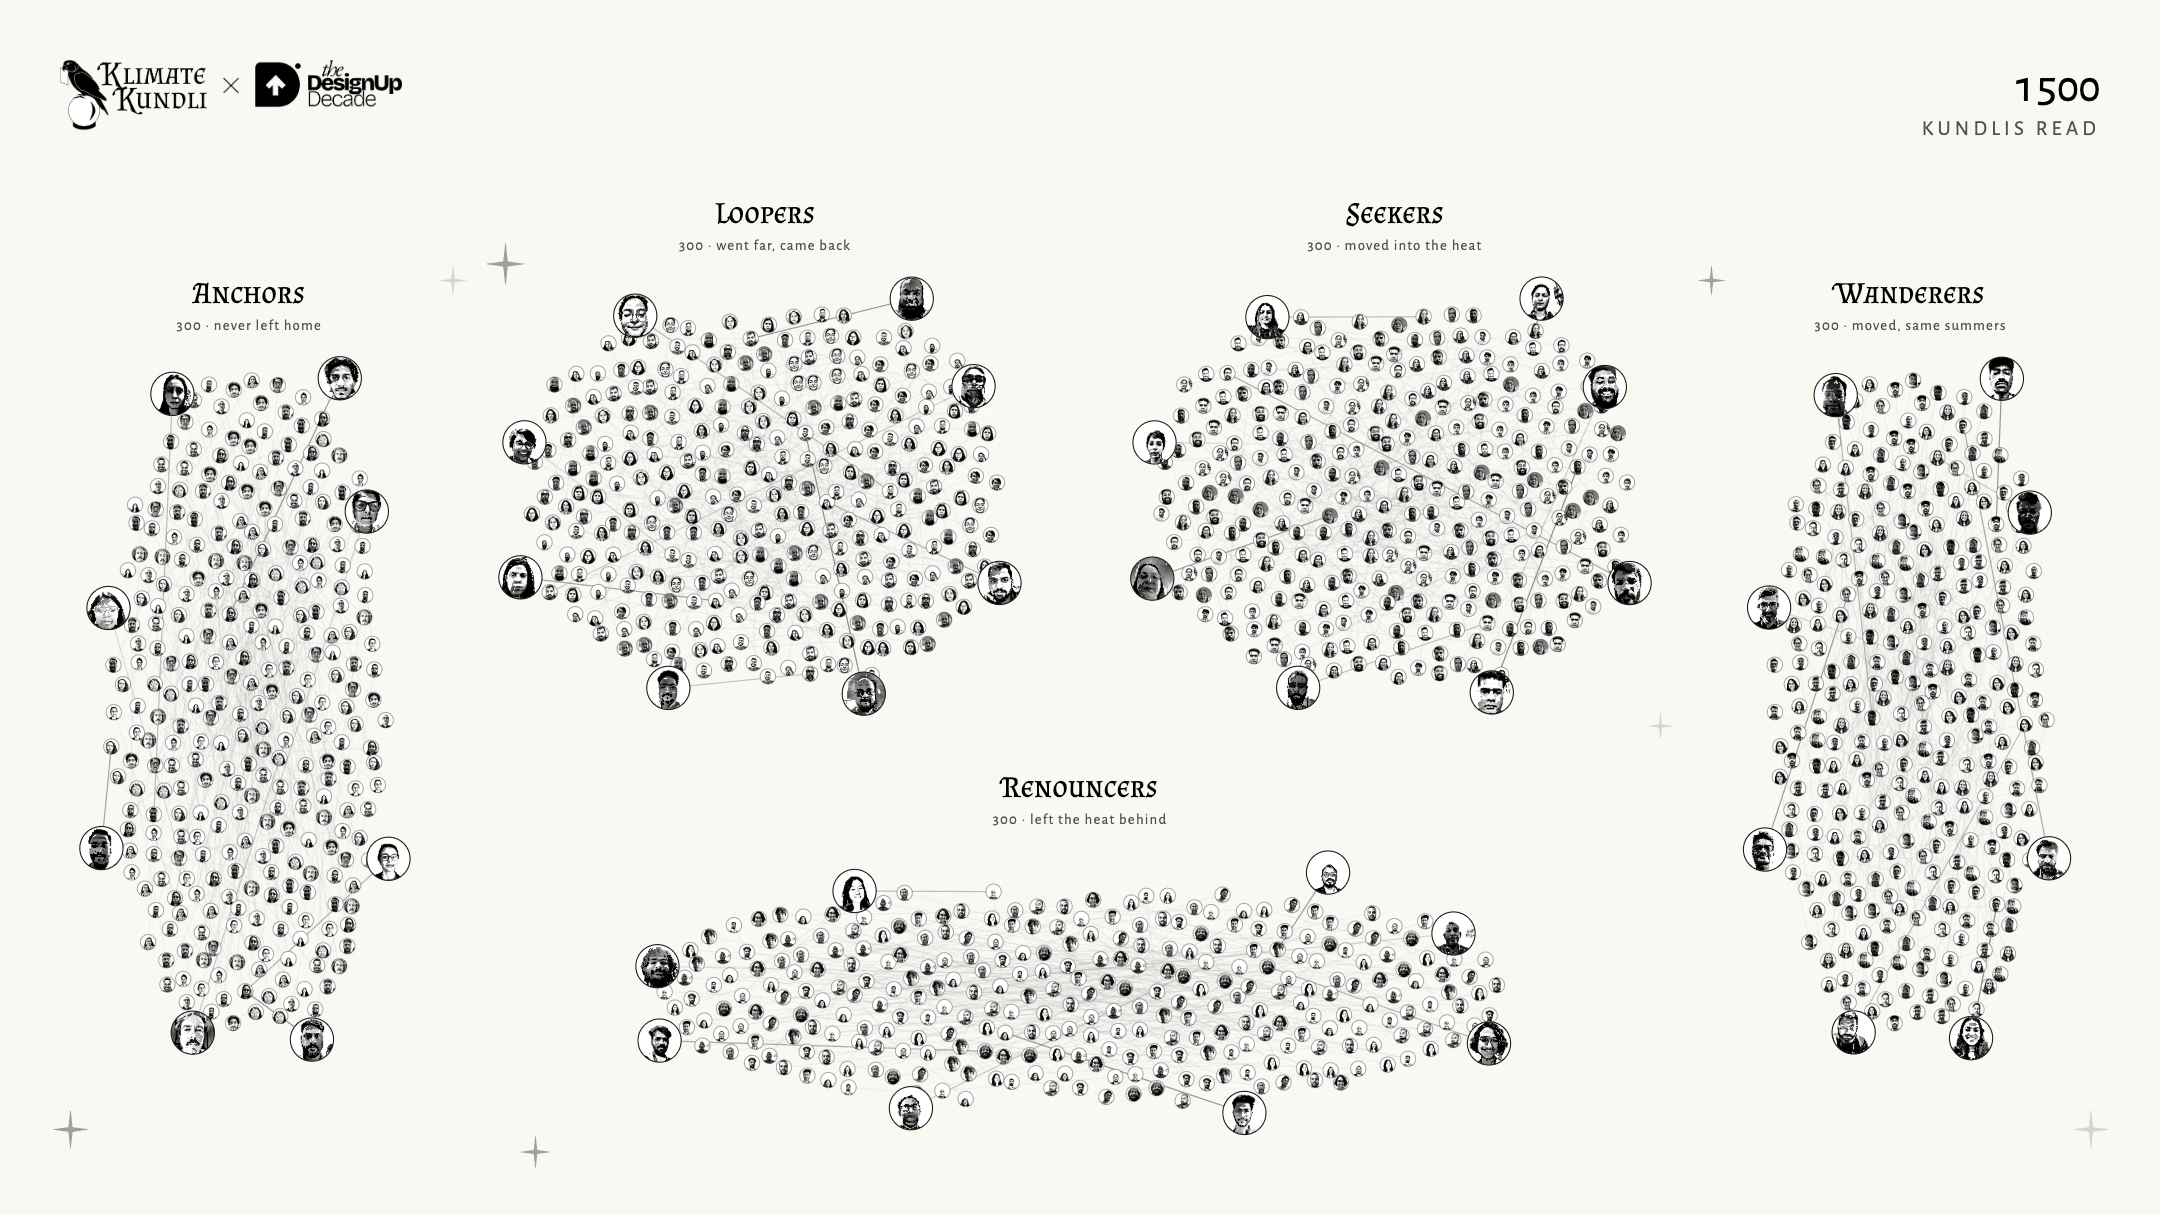
On the shared screen, a new portrait rose from the bottom, introduced its sign, then flew into one of five constellations. Two arrivals could appear side by side. The newest forty stayed prominent; older faces settled into smaller places in the cluster. Lines connected each arrival to a Twin.
The layout went through a flat scatter, five fixed groups, then constellations that claimed space according to their headcounts. A crowded group had to grow without making everybody else’s face tiny. We tested the sky with 1,500 fictional visitors, and added a fallback to keep the last working layout on screen if a new one failed.
Kundli matching, with climate
The other extension borrowed from kundli matching: Twin for a similar path, Mirror for an opposite one, Elder/Echo for someone on that path from another generation. Tickets on the reading showed who to look for and why.
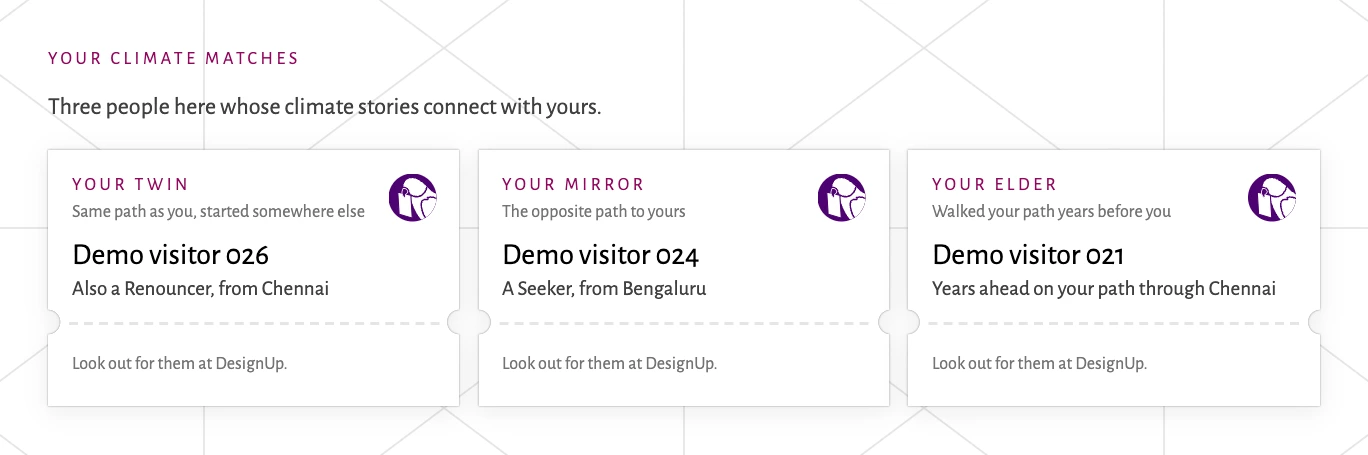
Filled matches could change as new people arrived, while a Twin line already drawn in the sky stayed put. Freezing matches on the server was the planned fix; it hadn’t shipped before the event. The match cards were hidden after DesignUp. We didn’t track how many introductions turned into conversations.
A smaller keepsake, a different printer
The A4 fortune teller became a 50 × 75 mm card: portrait, chart number, birthplace, sign, and a QR back to the reading. The full charts lived on the phone. The card warned that matches would vanish after DesignUp.
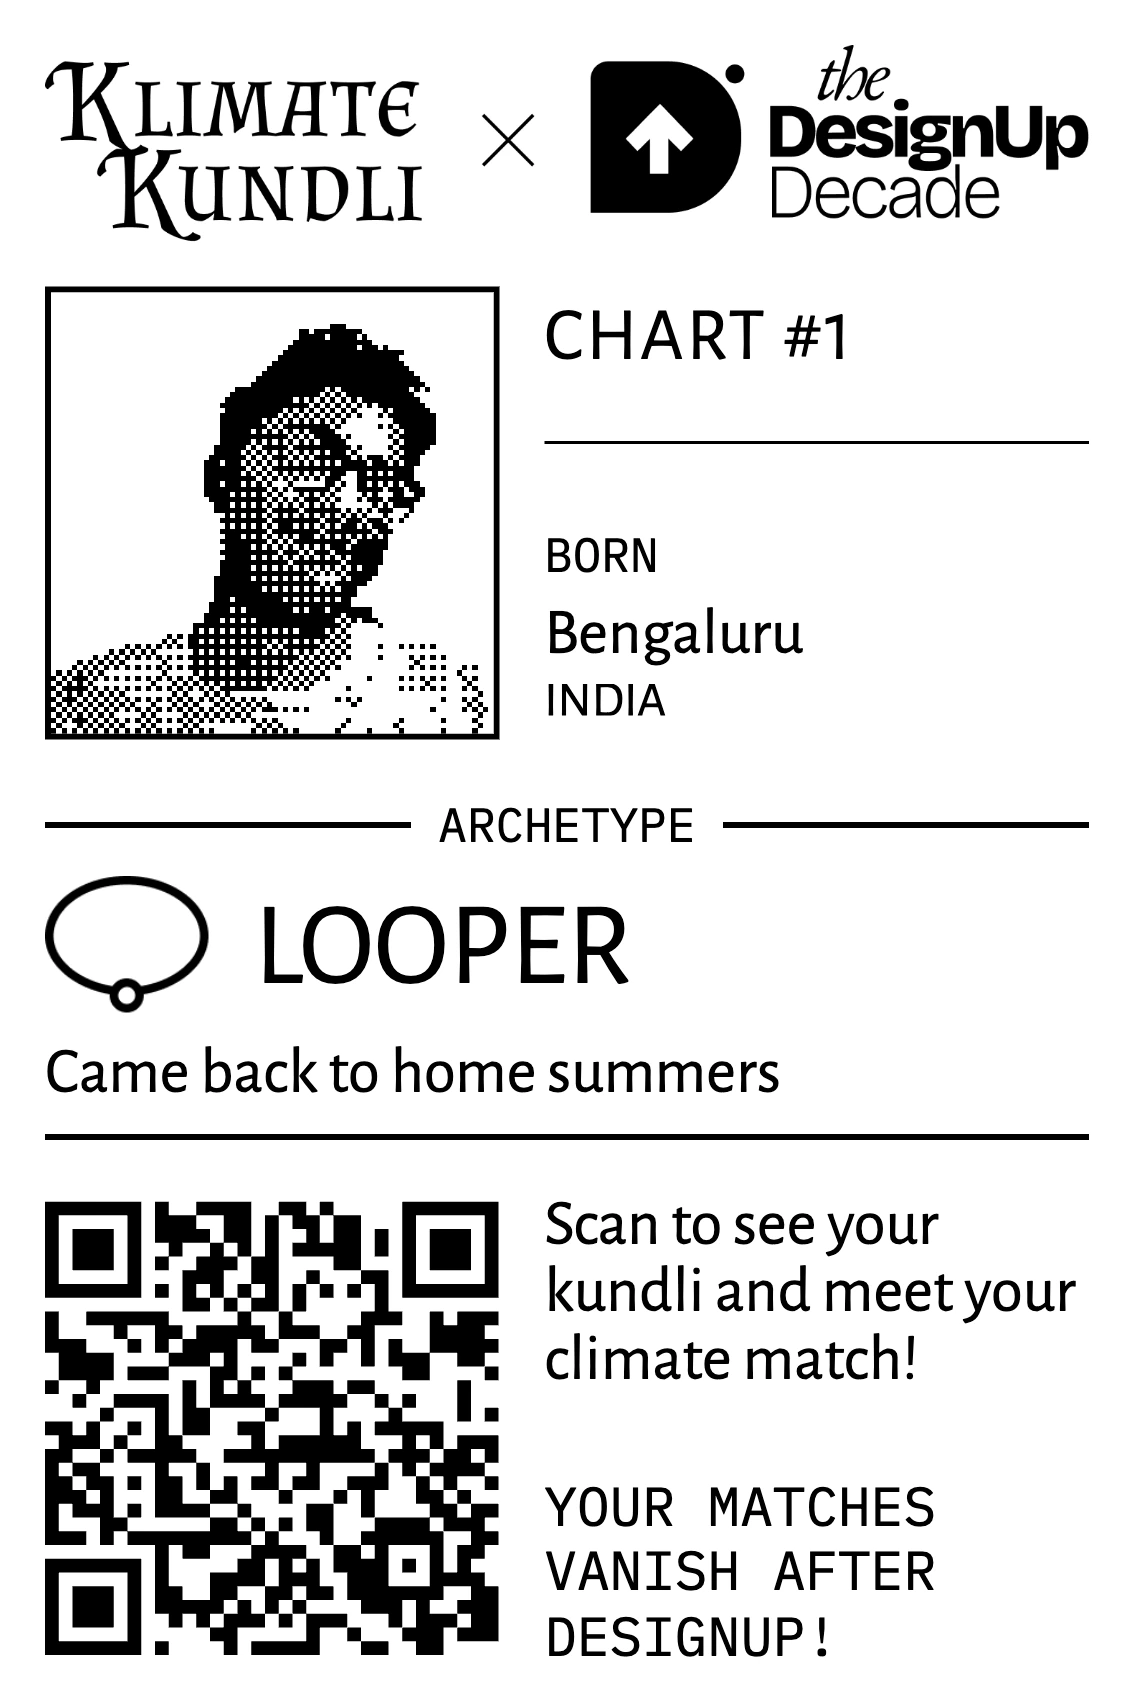
Printing meant dealing with a Bluetooth label printer from the booth iPads. Darkness, speed and image offset all needed tuning.
Someone could make their kundli on their own phone, scan its QR at the booth, and go straight to their card. After printing, the booth returned to Get Started.
The changes that couldn’t wait
Once the booth was running, small obstacles needed quick fixes:
- Dense badge QRs needed a full-resolution centre crop. A manual name-and-contact entry offered a way past a badge that wouldn’t scan.
- Returning visitors got their existing kundli back. They could edit their places without creating a second chart; people sharing an office contact were distinguished by their badge names.
- A confirmation caught visitors who generated with just their birth city despite having moved. City search also needed to open the phone keyboard on the first tap.
- “Look up” pointed a newly finished visitor towards the TV. “Show me in the constellation” let them find themselves again later.
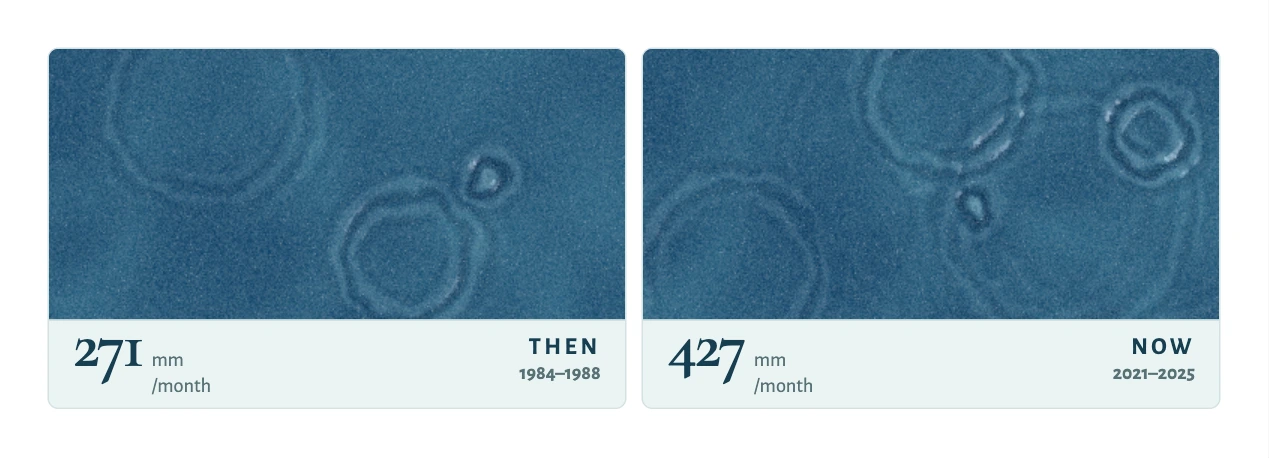
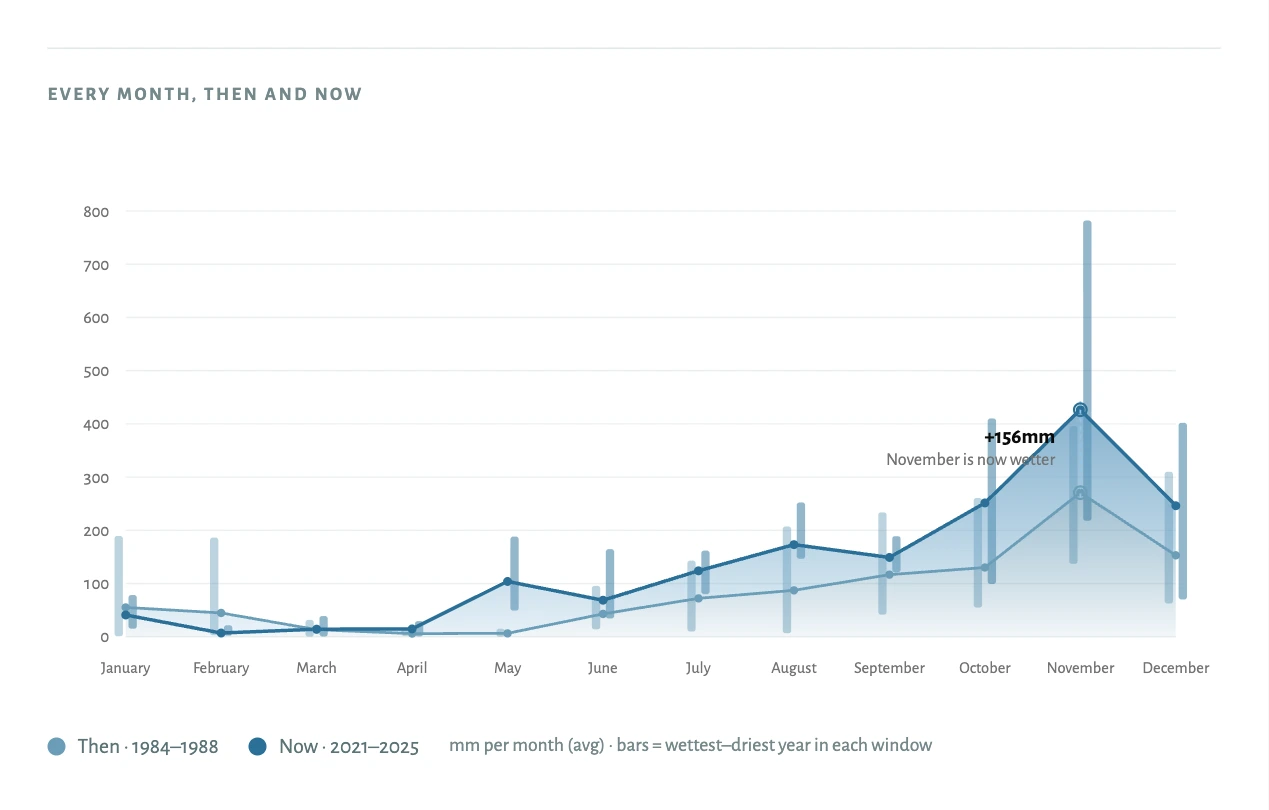
The reading changed too. Rainfall became a pair of animated ponds for a particular month, with the full yearly chart alongside. Labels grew on phones, a scroll hint led people to the remaining charts, and event readings stopped using the stacked-card presentation. The cache gained another 97 cities visitors had actually entered.
After the conference
The saved event corpus contains 482 kundlis, 383 cities, and 31 countries and territories. Of 478 timed sessions, the median time from entering the flow to tapping Generate was 1 minute 43 seconds. That excludes the wait for climate data, and doesn’t measure visitors who abandoned the flow.
The crowd’s journeys were interesting in their own right: after folding neighbourhood entries into their parent cities, 250 ended in Bengaluru, and 271 covered at least three distinct cities. We made an animated recap of their routes, warming stripes and summer comparisons. These are observations about the people who made a kundli, rather than a survey of the conference.
After DesignUp, the input and shared-screen experience were retired. Match identities, portraits and contacts were separated from the lasting climate reading; the retired profile API no longer serves them. Old card links redirect to the main site. The climate sign was fixed on each saved reading, and returning card scanners got a goodbye message.
The better birth-and-places flow moved to the public site.
Colophon
Klimate Kundli is made by Nithya Kirti M & Arko. Nithya originated the concept and led its visual design; I designed interactions, wrote the code, and wired up the climate data.
Thank you to Jay Dutta & Shiva Vishwanathan for bringing us to DesignUp, and to Akta Paneri for helping make it happen. To Debanshu Bhaumik, thank you for the continuing mentorship and belief in us.
For the booth, Dodo, the original charts, and the people who helped us get started, there’s the VizChitra casae study.